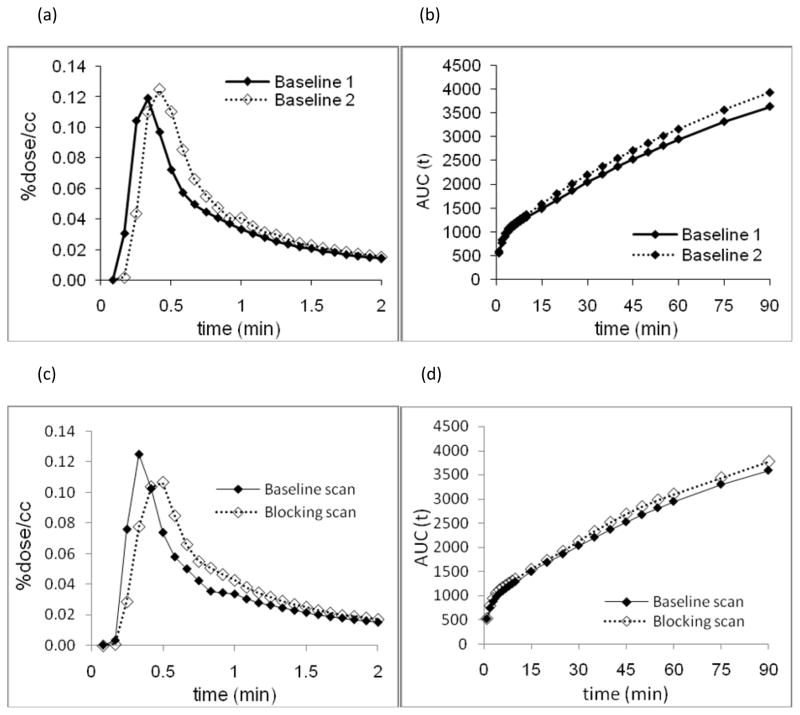
Figure 3.
(a) TAC’s of plasma from two baseline studies for the first two minutes. (b) Area under the curve (AUC) of [11C-cyano]letrozole concentration in plasma over a 90 minute experiment for the two repeated baseline scans. (c) TAC’s of plasma from baseline study and blocking study (0.1 mg/kg of unlabeled letrozole co-administration) for the first two minutes (d) AUC of [11C-cyano]letrozole concentration in plasma over a 90 minute experiment at baseline and after letrozole treatment.

