
Figure 4.
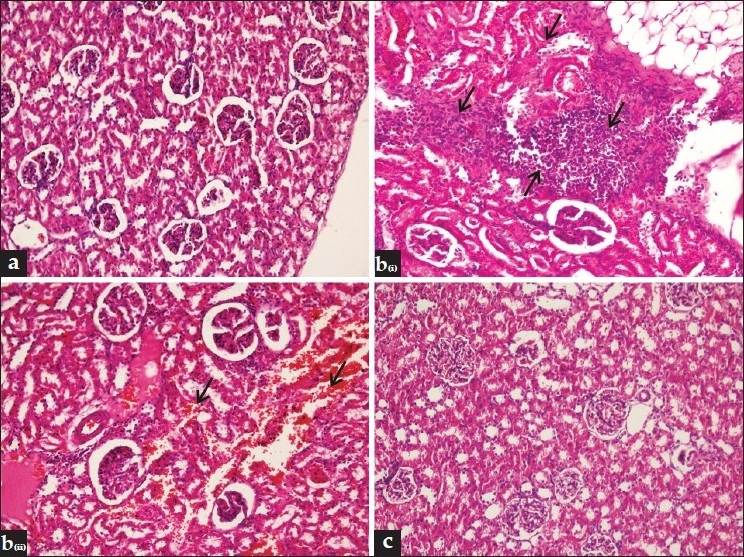
Renal histological analysis stained with hematoxylin and eosin (40×). ‘a’ is the kidney of control rat showing normal structure; ‘b’ is the kidney section of urolithiatic rats, with arrows showing areas of inflammation and hemolysis; ‘c’ is the kidney of group III (EG+ Tribulus terrestris) rats showing near normal renal structure