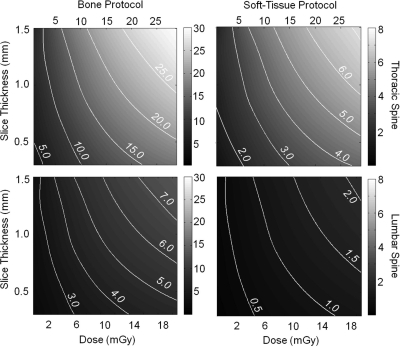
Figure 6.
CNR as a function of dose and slice thickness. Contour lines indicate constant CNR. (top) Bone and soft-tissue CNR in the thoracic spine. The less attenuating thoracic region yields higher bone visualization at comparable low radiation dose, as well as good soft-tissue visibility with high spatial resolution (MPR 0.9 mm). (bottom) Bone and soft-tissue CNR in the lumbar spine. Good bone detail visibility is achieved with a comparable low dose increase compared to the thoracic spine. Soft-tissue visibility in the more highly attenuating lumbar region requires increased dose to achieve acceptable CNR.

