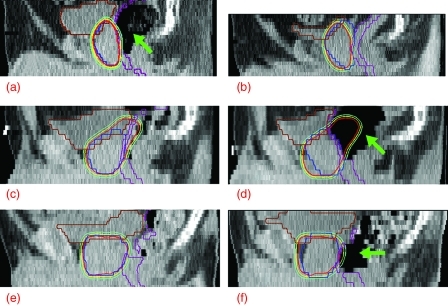
Figure 3.
The left column shows the sagittal view of the planned dose distributions for (a) the boost beams of patient 2, (c) the full-field beams of patient 4, and (e) the boost beams of patient 10. For comparison, the right column shows the same view of the dose distributions delivered in (b) the 10th boost fraction of patient 2, (d) the 11th full-field fraction of patient 4, and (f) the 14th boost fraction of patient 10. The blue, purple, and brown contours represent PTV2, anterior rectal wall and bladder, respectively. The three isodose lines, from inside out, were drawn at 2, 1.92, and 1.79 Gy, corresponding to 78, 75, and 70 Gy in the full 78 Gy course. The green arrows in (a), (d), and (f) are used to indicate the location of large volumes of rectal gas.

