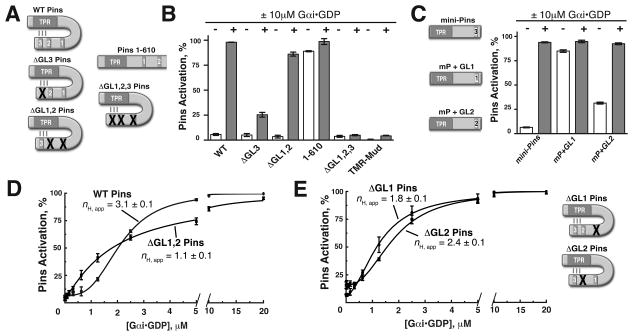
Figure 2. Pins GoLoco 3 is coupled to output while GoLocos 1 and 2 shape the pathway response curve.
(A) Schematic of the Pins mutants used in this study. Inactivating point mutations to various GL domains (R to F of conserved E/DQR triad) are represented by a red “X” over the mutated domain.
(B) GL3 is the key regulatory element for pathway activation and repression. Bar graphs represent Pins activation (%) in the absence (−, white) or presence (+, gray) of 10μM Gαi for Pins constructs shown in (A). ΔGL3 (R631F) is only weakly activated, while the ΔGL1,2 (R486F and R570F, respectively) is nearly fully activated. Deletion of the GL3 domain (Pins amino acids 1–610) breaks autoinhibition, while the ΔGL1,2,3 Pins is unable to be activated by Gαi.
(C) Activation of minimally repressed Pins (“mini-Pins”) consisting of a fusion of the GL3 region to the Pins TPRs (aa 42–396:590–639). Mini-Pins is able to reconstitute autoinhibition of the TPRs and can be activated by Gαi. Substitution of GL1 for GL3 in this context (mP + GL1) is unable to restore autoinhibition, while GL2 (m P +GL2) has an intermediate effect.
(D) GLs 1 and 2 are required for ultrasensitivity. Inactivating mutations to GLs 1 and 2 in ΔGL1,2 Pins (R486F and R570F respectively) abolishes ultrasensitivity in the system as the profile is graded nH,app = 1 (red curve).
(E) Contributions of GL1 and 2 to ultrasensitivty. Single mutation of either GL1 or GL2 has differing effects on ultrasensitivity. ΔGL1 (R486F, nH,app = 1.8 ± 0.1) decreases threshold and steepness while ΔGL2 (R570F, nH,app = 2.4 ± 0.1) partially decreases thresholding and steepness. Error bars represent one standard deviation from three independent experiments. See also Figure S2.

