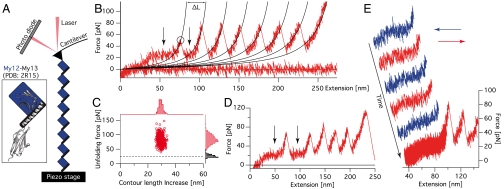
Fig. 1.
Force spectroscopy on My12 homooctamers. (A) Schematic representation of a My12 homooctamer in the AFM experimental setup (not to scale). The blue squares and the black bars represent the My12 Ig domains and their linker helices, respectively (compare to Inset with cartoon representation of the My12-My13 structure) (B) Typical force-extension trace of (My12)8 unfolding. The circle marks a single unfolding event; black traces represent worm-like chain fits providing the contour length increases ΔL of a single unfolding. The arrows indicate the force plateau. (C) Scatter plot of unfolding forces and corresponding contour length increases with respective distributions (red). The black histogram gives the plateau force distribution and the dashed line its mean value. (D) (My12)8 trace with coincidental double Ig-domain unfolding. The force plateau (arrows) can be observed before and after this event. (E) Force-extension trace containing stretch (red) and relax (blue) cycles to test the reversibility of the plateau. In the final stretching cycle unfoldings of the Ig domains can be observed.

