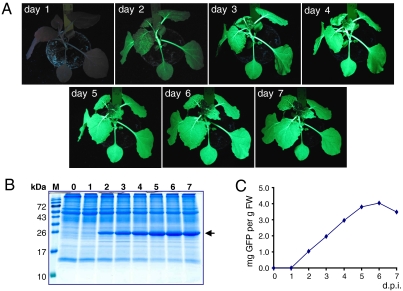
Fig. 4.
Time course of GFP expression after induction. (A) Pictures of the same plant taken under UV light at 1–7 d after ethanol treatment. (B) Total protein extracts of different plants harvested before (day 0) or at different times after induction (day 1–7). The arrow points to GFP (27 kDa). M: molecular mass standard. (C) GFP concentration measured by fluorescence spectrometry on the same samples as in (B).

