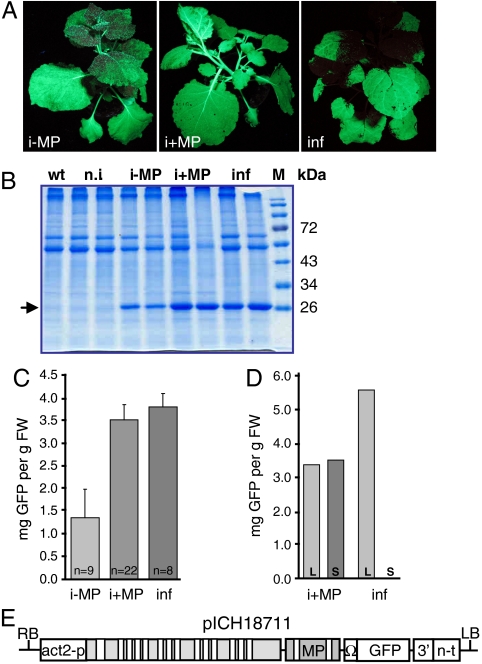
Fig. 5.
Quantification of expression. (A) Pictures of induced plants and of a vacuum-infiltrated plant. i-MP, induced transgenic plant lacking MP (pICH18951/pICH18693); i+MP, induced transgenic plant containing MP (pICH20592/pICH18693); inf, WT plant infiltrated with pICH18711; (B) SDS-PAGE with crude plant extracts. n.i., noninduced transgenic plants, M, molecular mass standard. The arrow points to GFP. (C, D) Fluorescence spectrometric measurements of GFP concentration. (C) Average GFP concentration in extracts from the entire aerial part of induced or infiltrated plants. Error bars indicate standard deviation. n, number of plants analyzed. (D) GFP amount in leaf (L) and stem (S) tissue extracted separately for individual plants. (E) Map of the T-DNA region of construct pICH18711 used for vacuum infiltration. Act2-p, promoter of the A. thaliana actin2 gene. All other elements are explained in Fig. 1.

