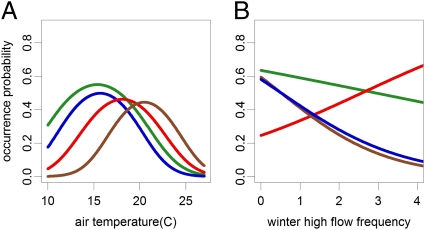
Fig. 2.
Occurrence probability of trout species as a function of air temperature (A) and winter high flow frequency (B). Green indicates cutthroat trout; blue indicates brook trout; red indicates rainbow trout; brown indicates brown trout. The different temperature and flow metrics for different species were standardized to a common x axis in each panel to facilitate comparisons; the figures are shown with original axes and with confidence intervals in Fig. S1.

