Fig. 3.
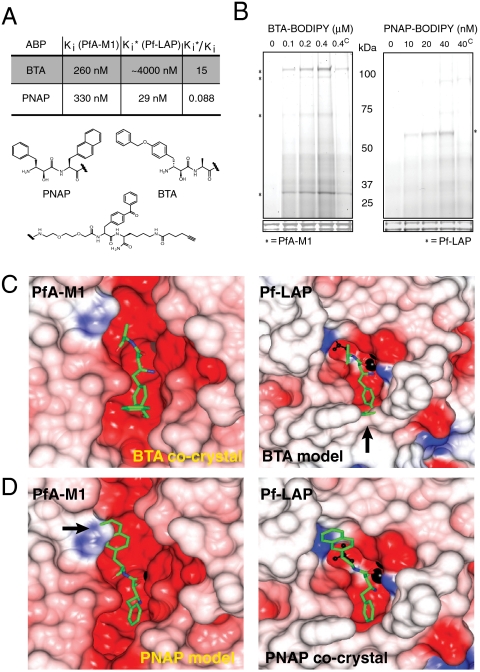
Biochemical and structural characterization of BTA and PNAP specificity against PfA-M1 and Pf-LAP. (A) Kinetic evaluation of inhibition for PNAP and BTA on recombinant PfA-M1 and Pf-LAP reveal over 15-fold specificity for PfA-M1 over Pf-LAP by BTA; PNAP showed greater than 10-fold specificity for Pf-LAP over PfA-M1.  for BTA for Pf-LAP was estimated due to solubility issues. (B) Activity-based protein profiling using “click” fluorescent versions of BTA or PNAP show that each probe specifically targets PfA-M1 or Pf-LAP, respectively (as indicated by an asterisk). (The superscript “C” in lane 5 of both panels indicates pretreatment with 10x of the nonfluorescent version of the respective ABP). (C) The electrostatic potential surface of the cocrystal of PfA-M1 with BTA (Left) and model of Pf-LAP with BTA bound in active site (Right). (D) The electrostatic potential surface of the model of PfA-M1 with PNAP (Left) and surface of the cocrystal of Pf-LAP with PNAP (Right). The zinc ion is shown as black sphere, the carbon atoms of inhibitors in green. Residues 755–1090 of PfA-M1 are excluded for clarity and a single monomer active site is shown for Pf-LAP. Surfaces were color coded according to electrostatic potential. Arrows show points at which either PNAP or BTA sterically clash with the enzyme.

