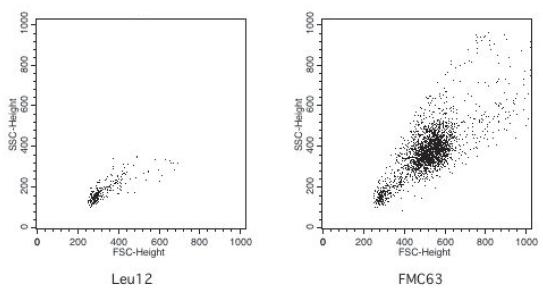
Figure 5. Leu12+ B cells have low forward and side scatter, in contrast to FMC63+ B cells which include a subpopulation with high forward and side scatter.
MM PBMC were stained with Leu12 or FMC63. Files were gated on the CD19+ population for each antibody: Leu12+ = 3.3% of PBMC and FMC63+ = 29% OF PBMC. B4+ B cells had the same scatter profile as did FMC63+ B cells. B1+ or rituximab+ B cells also have a scatter profile comparable to that of the FMC63+ B cells. The vertical axis represents side scatter (SSC) and the horizontal axis represents forward scatter (FSC). The horizontal axes from left to right represent increasing extent of forward scatter. The left panel shows a single population of Leu12+ B cells having low side and forward scatter. The right panel shows the two subpopulations distinguished by FMC63 (FMC63+ high side or forward scatter, and FMC63+ low side or forward scatter).

