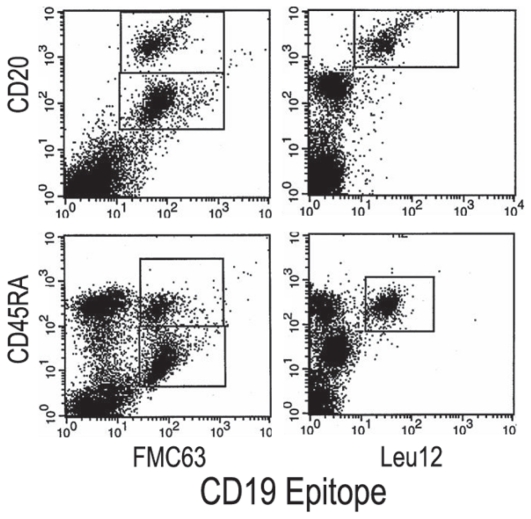
Figure 6. Phenotypic analysis of CD19, CD20 and CD45RA identify two distinct populations of CD19+20+ B cells.
Representative MM PBMC were stained with anti-CD19-FITC (horizontal axis) and either CD20-PE vertical axis, top row) or CD45RA-PE (vertical axis, bottom row). The boxes indicate subopulations defined by this analysis. The left top panel shows FMC63+ CD20Moderate, and FMC63+CD20bright subpopulations, and the left bottom panel shows FMC63+CD45RAbright and FMC63+CD45RAdim populations. The right panels show a single population identified by Leu12.

