Figure 1.
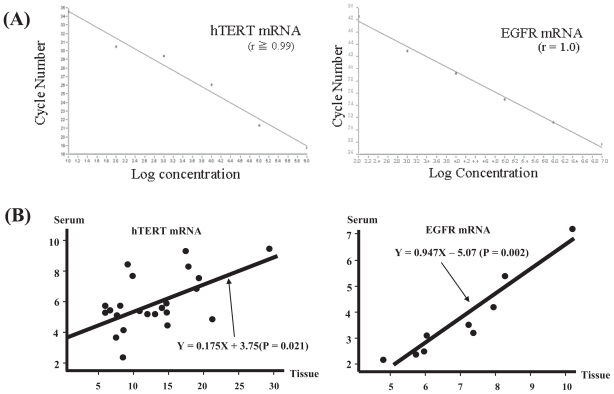
(A) In each quantitative assay, a strong linear relation was demonstrated between copy number and PCR cycles using RNA controls for concentration (r = 0.99 for hTERT mRNA: left; r = 1.0 for EGFR mRNA: right). The dynamic ranges of real-time PCR analysis for hTERT mRNA and EGFR mRNA were more than approximately 5~10 copies in this assay and we were able to exclude the possibility of false negativity in serum samples from patients and controls. Control hTERT mRNA for standardization was generated using T7 RNA polymerase in pLIXN-hTERT cDNA kindly provided from Dr. H. Tahara (Hiroshima University, Japan) and another control EGFR mRNA was similarly generated using pCRII-TOPO-EGFR (Invitrogen Japan K.K, Tokyo, Japan) retrofitted from pME18SFL3-EGFR purchased as FLJ cDNA clone commercially (TOYOBO, Tokyo, Japan). (B) A dot plot represents the significant correlation of (left) hTERT mRNA level in serum in lung cancer tissues in 23 patients and of (right) EGFR mRNA level in serum in lung cancer tissues in 9 patients. Only a minority of the cases that were positive for mRNA in the tissue specimens (n = 23 for hTERT, n = 9 for EGFR) is included in this analysis. Positive is defined as “above the predictive cut-off values for both mRNAs obtained from this study in 112 lung tumors and 80 healthy individuals”. These data were analyzed by the paired t test (p < 0.01 for both) and non-parametric Spearman’s test (p = 0.021 for hTERT mRNA, p = 0.002 for EGFR mRNA, respectively). The data were evaluated by logarithm of quantification.

