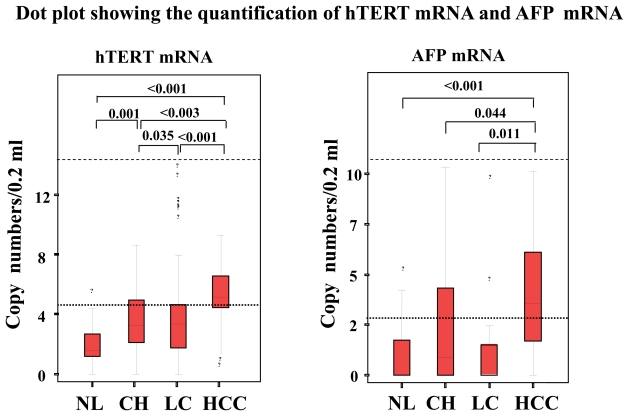
Figure 2.
(left) hTERT mRNA levels and (right) AFP mRNA level (on logarithmic scales) in serum from patients with HCC, LC, CH, and healthy individuals by real-time RT-PCR. The 95% confidence interval in each group is shown beside the dots. Significant differences between 4 groups are shown in the upper part of the figure. NL, individual with normal liver: OL, other liver diseases: CH, chronic hepatitis: LC, liver cirrhosis: HCC, hepatocellular carcinoma.

