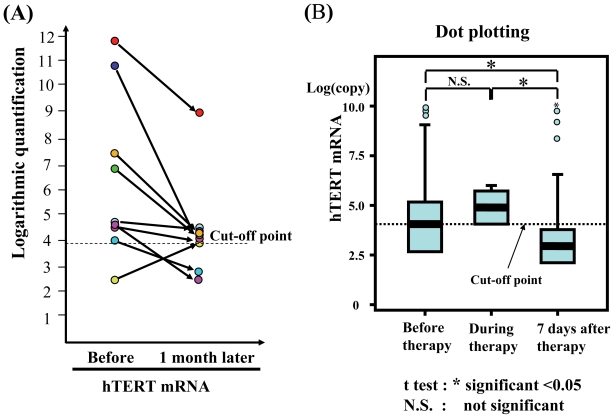
Figure 4.
(A) A dot plot representing the significant correlation between hTERT mRNA level in serum and that in gynecologic cancer tissues in 9 patients. Only a minority of the cases that were positive for mRNA in the tissue specimens (n = 8 for hTERT) is included in this analysis. Positive is defined as “being above the predictive cut-off values for both mRNAs obtained from this study in 89 lung tumors and 27 healthy individuals”. These data for hTERT mRNA were analyzed by Wilcoxon’s test and the paired t test (p < 0.028 and p = 0.035, respectively). The data are evaluated by a logarithm of quantification. (B) The quantification of both mRNAs in the serum before, during, and 7 days after any treatment including chemotherapy or surgical treatment is stratified into three groups. The data are evaluated by a logarithm of quantification. hTERT mRNA expression among the three groups was evaluated by the paired t test (*p < 0.05). N.S. means not significant.

