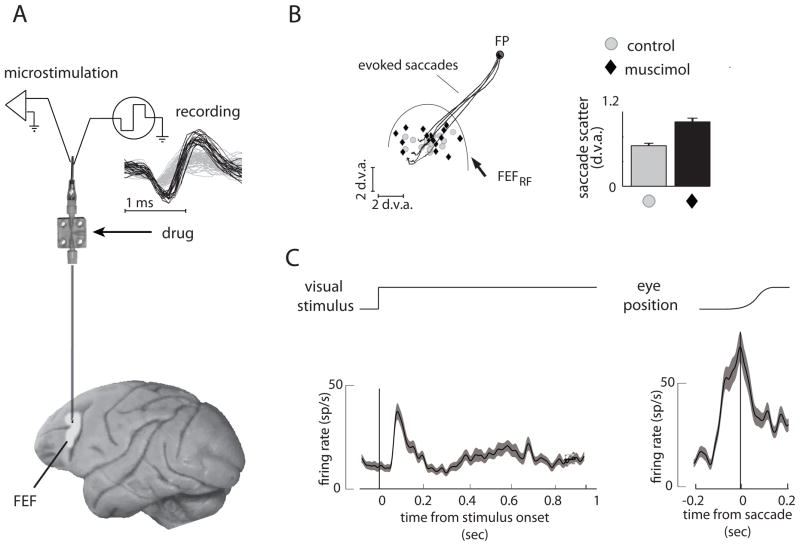
Figure 4.
A sample experiment in which single-neuron recording, electrical microstimulation and microinjection was carried out in the frontal eye field (FEF). (A) Examples of single-neuron waveforms (black traces) isolated from background (gray traces) are shown at top. (B) Response field of neurons at the FEF site (FEFRF) and the endpoints of saccades evoked by microstimulation are shown. Black traces show trajectories of microstimulation-evoked saccades. Gray circles indicate landing points of visually-guided saccades to targets within the FEFRF. Visually guided saccades were more scattered after infusion of 500 nl of 5 mg/ml muscimol (black diamonds). The bars at right show mean±SEM of saccade scatter (before= 0.68±0.25 d.v.a.; after= 1.08±0.36 d.v.a.; p=0.005, Wilcoxon sign-rank test). (C) Responses of a single-neuron to a visual stimulus (left) and at the time of a saccade (right) recorded before infusion. Abbreviation: d.v.a., degrees of visual angle.

