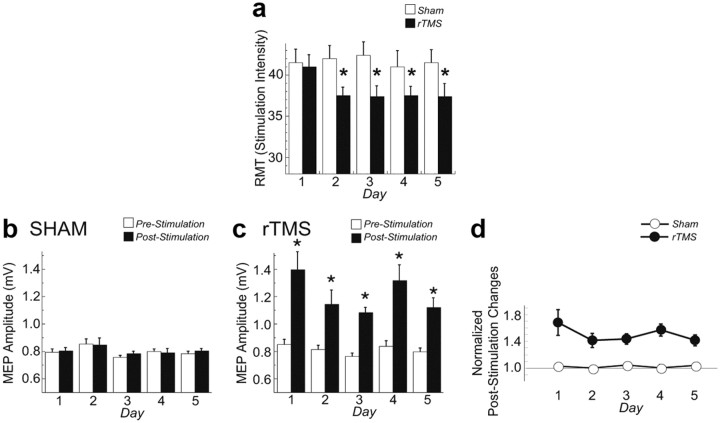
Figure 6.
The effects of rTMS on RMT and on the amplitude of MEP. a, RMT is plotted as a function of day for the rTMS and sham treatment. RMT significantly decreased in the rTMS but not in the sham session starting from the second day of treatment. The asterisk indicates significant differences (p < 0.005) with a post hoc test. b, c, Mean MEP amplitude before and immediately after sham (b) and rTMS (c) are plotted as a function of day. MEP amplitude significantly increased only after each rTMS treatment (asterisks: p < 0.0001). d, The poststimulation changes (computed as the pre–post stimulation MEP differences normalized by the pre-MEP amplitude for each day) did not differ across days (p > 0.1) for either sham or rTMS treatment.

