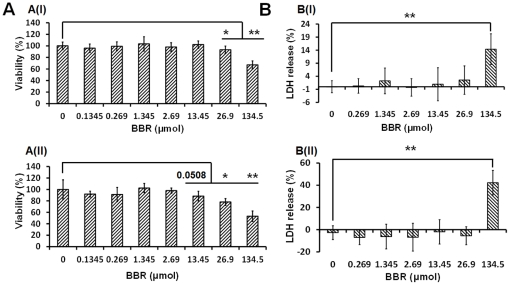
Figure 1. Cytotoxicity assay of berberine.
(A) represents the cytotoxicity of BBR from the MTT assay: A(I) and A(II) represent the cytotoxicity of BBR to PC12 cells 12 hours and 24 hours after drug administration, respectively; (B) represents the LDH release of PC12 cells after BBR addition: B(I) and B(II) represent the amount of LDH released from PC12 cells 12 hours and 24 hours since BBR incubation. In the MTT assay, the group with 0 µmol of BBR was considered the control group; in LDH release assay, the spontaneous release of LDH from the BBR-free group (0 µmol) was considered the control group. The percentage of LDH release was calculated by the equation: LDH release (%) = (Experimental LDH release-Spontaneous LDH release)/Maximum LDH release. * p<0.05, ** p<0.01 vs control. Data were presented as mean ± S.D. from twelve independent experiments. (n = 12).

