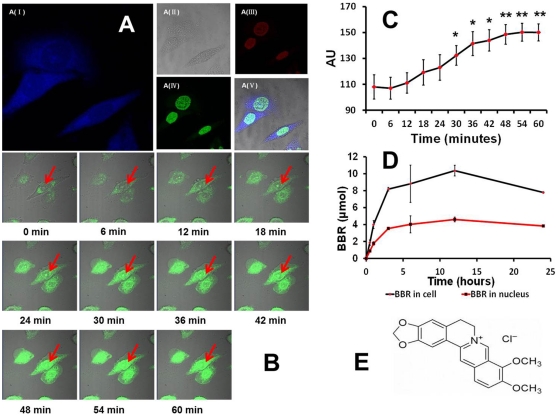
Figure 2. Distribution of berberine in a living cell.
(A) (from I to V) depicts images of the subcellular location of BBR in PC12 cells one hour after BBR administration. The fluorescence of BBR is shown in blue in A (I); A (II) represents PC12 cells in visible light; A (III) and A (IV) represents the nucleus stained by PI and AO, respectively; figure A (V) is the merged image of A (I), A (II), A (III), and A (IV). (B) represents the process of BBR entering the nucleus. The fluorescence of BBR is shown in green in this figure, and the red arrow points to the nuclear region. All of the images in (B) were taken under the same conditions with a time interval of 1.2 min. (C) represents the fluorescence intensity of BBR in the nucleus. * p<0.05, ** p<0.01 vs control (0 minutes after BBR administration). (D) represents the time-resolution change of berberine in live cells and the nucleus, which was detected by HPLC. (E) represents the chemical structure of BBR. Data were presented as mean ± S.D. from three independent experiments (n = 3).

