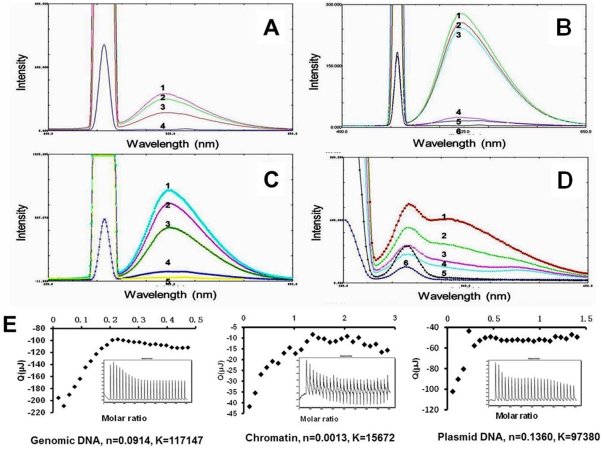
Figure 3. Interaction between berberine and genetic components.
(A) represents the fluorescence spectrum of BBR (10 µmol) associating with chromatin (15.3 µmol, spectrum 3; 30.6 µmol, spectrum 2; 45.9 µmol, spectrum 1; 0 µmol, spectrum 4); (B) represents the fluorescence spectrum of BBR (10 µmol) associating with plasmid (138.2 µmol, spectrum 1; 92.1 µmol, spectrum 2; 44.6 µmol, spectrum 3; 0 µmol, spectrum 4; spectrum 5 and spectrum 6 represent the fluorescent spectrum of plasmid and buffer, respectively); (C) represents the fluorescence spectrum of BBR (10 µmol) associating with genome (30.8 µmol, spectrum 3; 61.6 µmol, spectrum 2; 92.4 µmol, spectrum 1; 0 µmol, spectrum 4; spectrum 5 represents the fluorescence spectrum of buffer); (D) represents the fluorescence spectrum of tryptophan in chromatin (3.1 µmol) associating with BBR (0 µmol, spectrum 1; 10 µmol, spectrum 2; 20 µmol, spectrum 3; 30 µmol, spectrum 4; spectrum 5 and spectrum 6 represent the fluorescence spectrum of BBR and buffer, respectively). According to (A), (B), and (C), the exciting wavelength is 456 nm and the emission wavelength is 548 nm. The exciting and emission wavelength in (D) is 280 nm and 330 nm, respectively. (E) portrays the isothermal calorimetric measurements revealing the detailed parameters concerning the association of BBR with genomic DNA, chromatin, and plasmid DNA, respectively.

