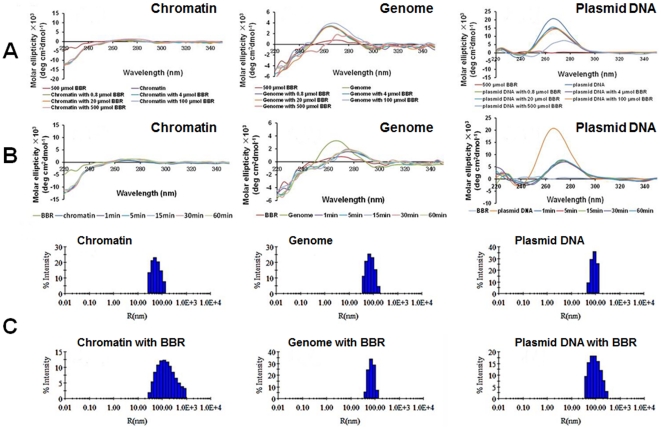
Figure 4. Spatial conformational change induced by berberine.
(A) represents the dose-dependent alterations in circular dichroic spectrum of genome, chromatin, and plasmid, respectively. (B) represents the time-dependent alterations in circular dichroic spectrum of genome, chromatin, and plasmid, respectively. (C) represents the effect of BBR (500 µmol) on the intensity distribution (%) of chromatin (92.4 µmol), genome (423.2 µmol), and plasmid (808 µmol) in size (diameter) obtained from DLS measurements, respectively.

