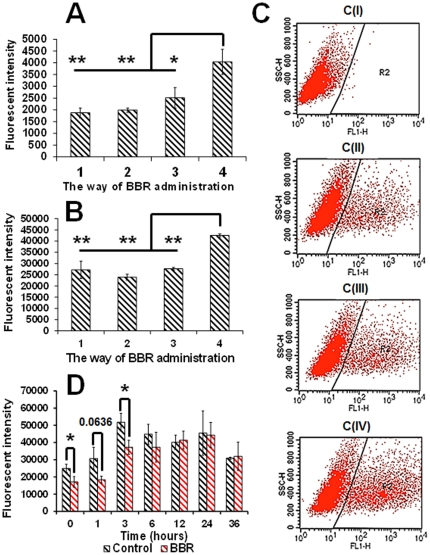
Figure 5. Suppressive effect of BBR on the expression of green fluorescent protein in PC12 cells.
(A) and (B) represent the suppressive effect of BBR on the expression of GFP 12 hours and 24 hours after drug administration, respectively. The value on the x-axis represents the method of drug administration: (1) denotes that BBR has been incubated with PC12 for 1 hour before transfection; (2) denotes that BBR has been incubated with plasmid for 5 minutes before transfection; (3) denotes that BBR was administered 6 hours after transfection; (4) denotes transfection without BBR administration. (C) portrays the method of data collection according to the flow cytometry experiments. C (I), C (II), C (III), and C (IV) represent the method of data collection of PC12 cells without GFP expression, GFP expressing PC12 cells with BBR treatment for 12 hours, GFP expressing PC12 cells with BBR treatment for 24 hours, and GFP expressing PC12 cells without BBR treatment, respectively. The R2 region in the images in (C) characterizes the definition of GFP expressing cells in the cell population. (D) depicts the recovery of GFP expression after the elimination of 12 hour-BBR-treatment (n = 3). (Compared with group 4, * p<0.05, ** p<0.01). Fluorescence intensity = G×M, where G indicates the number of fluorescent cells and M is the mean fluorescence intensity of fluorescent cells.

