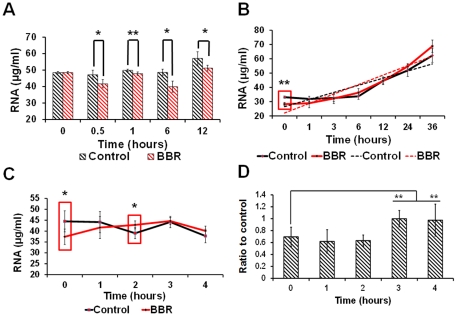
Figure 6. The suppressive effect of berberine on gene transcription in live cells.
(A) portrays the time-dependent effect of BBR on gene transcription on a global level. (B) shows the time-dependent recovery of the global RNA level after the elimination of a 12 hour-BBR treatment. The linear equation of the control group in (B) is: y = 4.9836×+21.516, R2 = 0.8162; the linear equation of the BBR group in (B)is: y = 6.6219×+15.472, R2 = 0.8941. (C) displays the protective effect of BBR on the global RNA level. (D) depicts the protective effect of BBR on the mRNA level of the transfected artificial plasmid, pEGFP-N1. The dosage of BBR in all of the experiments was 2.69 µmol. Data in D was the ratio of target gene in the BBR group to the same target gene in the BBR-free group at the same time-point (control group). * p<0.05, ** p<0.01 vs the corresponding control indicated above. Data were presented as mean ± S.D. from four independent experiments (n = 4).

