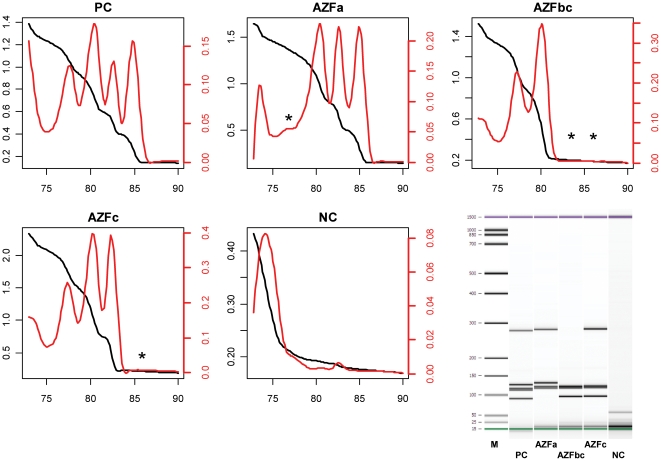
Figure 4. Multiplex Setup 2 (AMELxy).
The AMELxy multiplex setup was tested on genomic DNA from patients without deletions (PC), AZFa deletion (AZFa), AZFb+c deletion (AZFbc), AZFc deletion (AZFc) and on a non-template control (NC). Black curves represent the original melt curve (scaled on left ordinate), while the red curves represent the first derivative melt curve (scaled on right ordinate). Asterisks denote missing peaks in comparison to the positive control. The abscissas reflect temperature [°C], ordinates reflect relative fluorescence [AU]. Bottom right: Microelectrophoretic separation (Bioanalyzer) of the amplicons obtained with the different setups as above (M = size marker).

