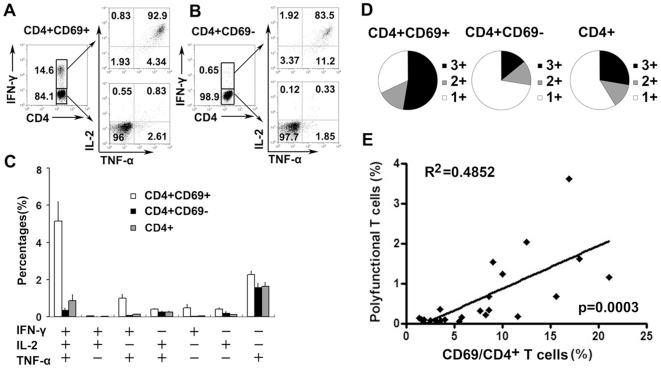
Figure 4. Significantly positive correlation between the percentages of CD4+CD69+ T cells and polyfunctional T cells.
(A) Cells were gated on CD4+CD69+IFN-γ+ and CD4+CD69+IFN-γ− cells, respectively. Representative expression of TNF-α and IL-2 within gated cells is shown. (B) Cells were gated on CD4+CD69−IFN-γ+ and CD4+CD69−IFN-γ− cells, respectively. The representative expression of TNF-α and IL-2 within gated cells is shown. The numbers in each quadrant represent the percentages of positive cells in gated T cells. (C) The average frequencies of CD4+CD69+, CD4+CD69− and CD4+ T cells expressing each of the seven combinations of IFN-γ, IL-2 and TNF-α from twenty-two independent experiments are demonstrated. The mean and SEM are shown. (D) Responses are grouped according to the number of functions. The pie charts summarize the fractions of single (1+ blank), double (2+ gray), and triple (3+ black) producers of IFN-γ, IL-2 and TNF-α within the CD4+CD69+, CD4+CD69− and CD4+ T cell subsets from twenty-two independent experiments. (E) Significant positive correlation between CD4+CD69+ T cells and polyfunctional T cells (p = 0.0003, n = 22).

