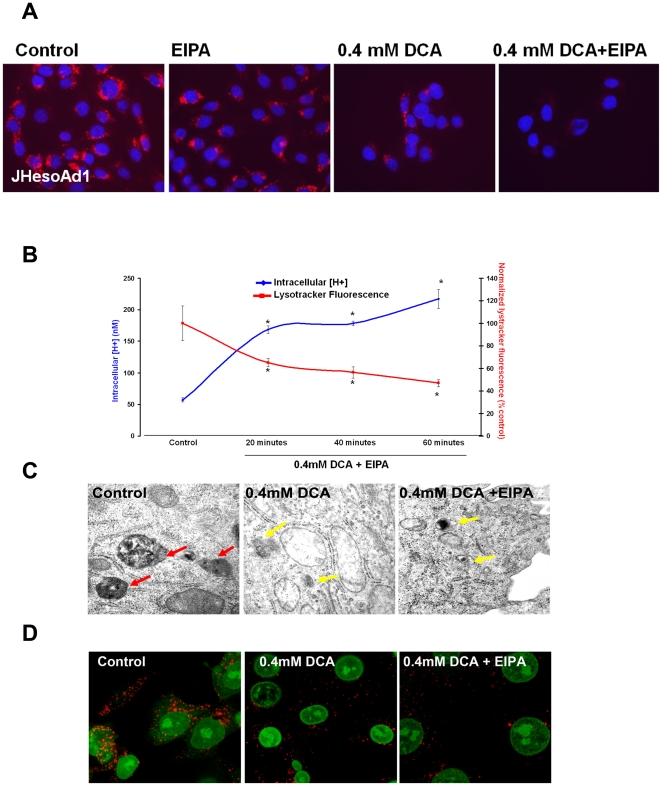
Figure 2. Lysosomal damage accompanies DCA-mediated intracellular acidification.
A) Representative images from fluorescent microscopy of Lysotracker-Red in JH-EsoAd1 cells following 60 minutes incubation with or without 0.4 mM DCA in the presence or absence of 20 uM EIPA. Red signal indicates acidic vesicles, blue signal is nuclear counterstain (DAPI). B) Intracellular [H+] and quantification of Lysotracker-Green fluorescence (ex/em 485/535 nm) normalized with Hoechst 33342 nuclear stain (ex/em 355/460 nm) in cells (n = 12 for each condition) following 60 minutes with or without 0.4 mM DCA in the presence of 20 uM EIPA. Data are expressed as % of control (*p<0.05). C) Representative image (31,000×) of cells incubated for 60 minutes with or without 0.4 mM DCA in the presence or absence of 20 uM EIPA. Red arrows indicate structurally intact lysosomes, yellow arrows indicate lysosomal membrane perturbation. D) Representative confocal microscopy images showing LAMP-1 (green signal) and nuclear stain for propidium iodide (red signal) in cells incubated for 60 minutes with or without 0.4 mM DCA in the presence or absence of 20 uM EIPA.

