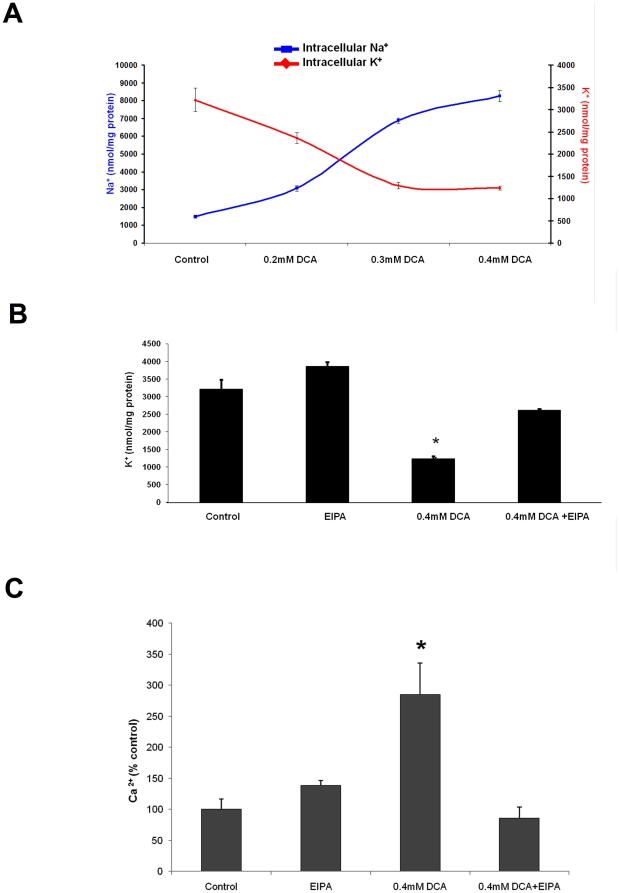
Figure 3. Inhibition of NHE prevents DCA-induced K+ efflux and rise of cytoplasmic Ca2+.
A) Total cell K+ (red trace) and Na+ (blue trace) levels in JH-EsoAd1 cells following incubation for 60 minutes with or without 0.4 mM DCA. The data are expressed as nmol ion/mg protein (n = 6). B) Total cell K+ levels in JH-EsoAd1 cells (n = 6) following 60 minute incubation with or without 0.4 mM DCA in the presence or absence of 20 uM EIPA (*p<0.05 compared to control). C) Cytoplasmic Ca2+ in JH-EsoAd1 cells (n≥20 cells for each condition from at least 2 independent experiments) determined by Fura-2 fluorescence following a 60 minute incubation ±0.4 mM DCA in the presence or absence of 20 uM EIPA, (*p<0.05 compared to control).

