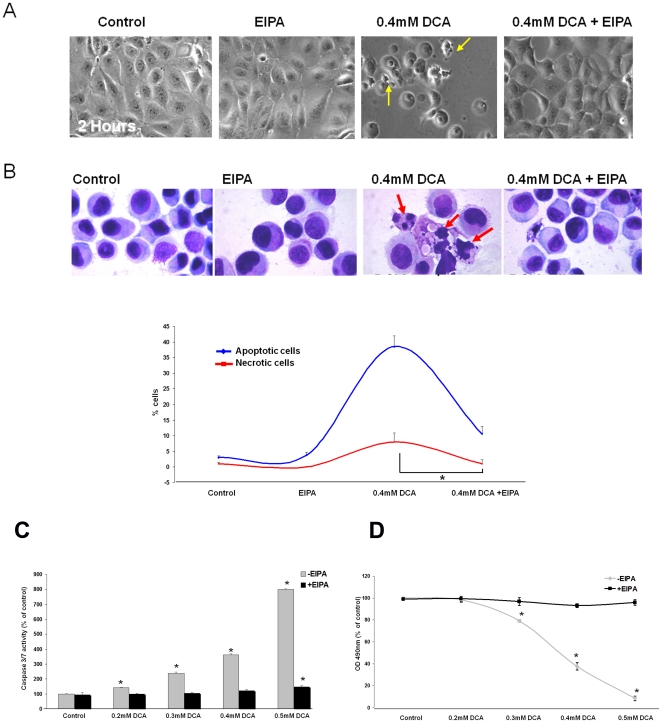
Figure 4. Inhibition of Na+ influx with EIPA prevents DCA-induced cell death.
A) Representative contrast microscopy images of JH-EsoAd1 cells following 120 minute incubation with and without 0.4 mM DCA in the presence or absence of 20 uM EIPA. Yellow arrows indicate damaged and apoptotic cells. B) The upper panel shows representative images of methanol-fixed cells stained with Geimsa (red arrows indicate apoptotic and damaged cells). The lower panel shows quantification of Geimsa stained cells (n = 6 for each condition) analyzed 24 hours after a 120 minute incubation with or without 0.4 mM DCA in the presence or absence of 20 uM EIPA. Data are expressed as % of apoptotic or necrotic cells (red trace indicates necrotic cells, blue trace indicates apoptotic cells,*p<0.05). C) Caspase-3/7 activity (n = 4) measured 24 hours following a 120 minute exposure to varying concentrations of DCA in the presence or absence of 20 uM EIPA (*p<0.05 compared to control). D) MTS assay (n = 16) analyzed 24 hours following a 120 minute exposure to DCA at varying concentrations in the presence or absence of 20 uM EIPA (*p<0.01 compared to control).

