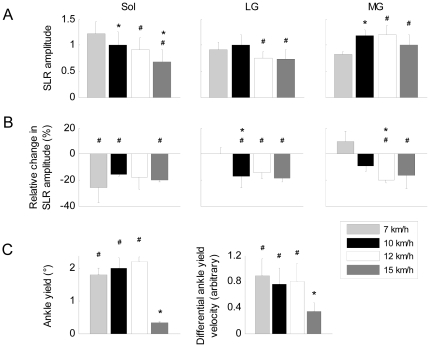
Figure 2. Mean SLR data.
A: Mean SLR amplitude at all speeds in the soleus and gastrocnemius muscles. B: Mean relative changes in SLR amplitude due to Achilles tendon vibration. C: Amplitude and velocity of ankle yielding at all speeds computed as the difference between the no vibration and 90 Hz vibration conditions 55–150 ms after ground contact. Positive values denote yielding in the 90 Hz vibration condition. For all plots, * denotes a significant difference from the immediately preceding running speed, and # denotes a significant difference between the no vibration and 90 Hz vibration conditions at a minimum level of p<0.05. Vertical bars represent 1 SD of the mean. n = 10 for all plots.

