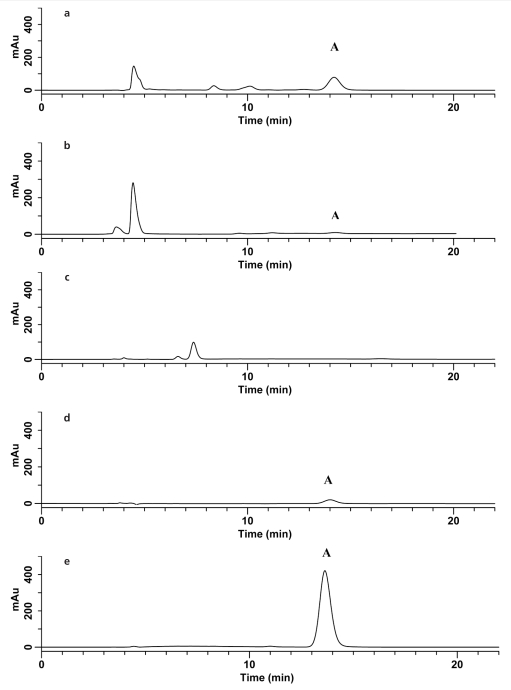
Figure 1.
Sample chromatograms of cefazolin sodium and degradation products. a: Cefazolin sample after 125 h of exposure to acid. b: Alkaline-degraded cefazolin sample after 5 h. c: Oxidized sample of cefazolin after 74 h. d: Cefazolin sample exposed to ultraviolet light for 361 h. e: Cefazolin sample obtained at time zero, before any form of degradation occurred. In all panels, peak A is cefazolin. Au = absorbance units.

