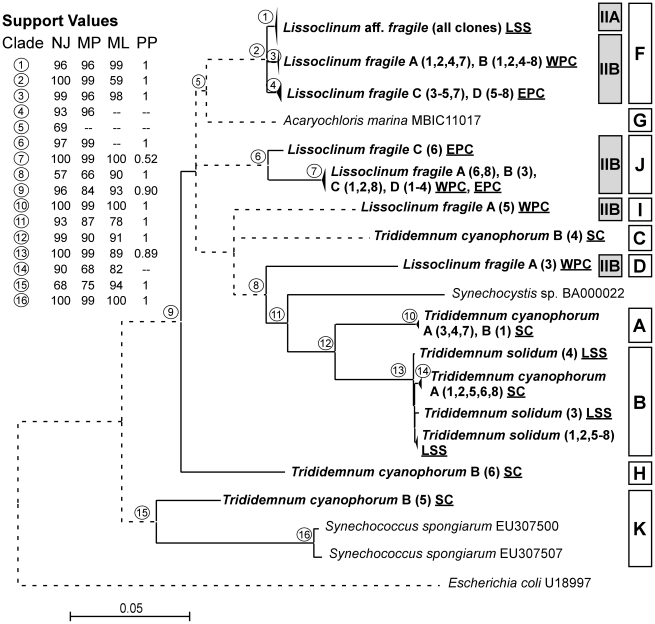
Figure 4. Phylogeny of 16S–23S ITS gene sequences from cyanobacteria isolated from Bahamian ascidians.
Sequences obtained in this study are highlighted (bold lettering). Labels on terminal nodes of sequences include sample name and clone sequenced (in parenthesis). Labels on terminal nodes of sequences from this study include sample name, clone sequenced (in parenthesis), and sample location (underlined: SC: Sweeting's Cay, LSS: Little San Salvador; WPC: West Plana Cay, and EPC: East Plana Cay). Bars as in Figure 3. Tree topology corresponds to the consensus obtained from neighbor-joining (NJ) analysis. Individual bootstrap values from NJ, maximum parsimony (MP) and maximum likelihood (ML) analyses and posterior probabilities (PP) from Bayesian inference are located in the upper-left box and correspond to circle numbers on tree nodes. Solid lines indicate bootstrap support greater than 50% from at least 2 of the 4 phylogenetic criteria, and dashed lines indicate weakly supported branches. Scale bar represents 0.05 substitutions per site.

