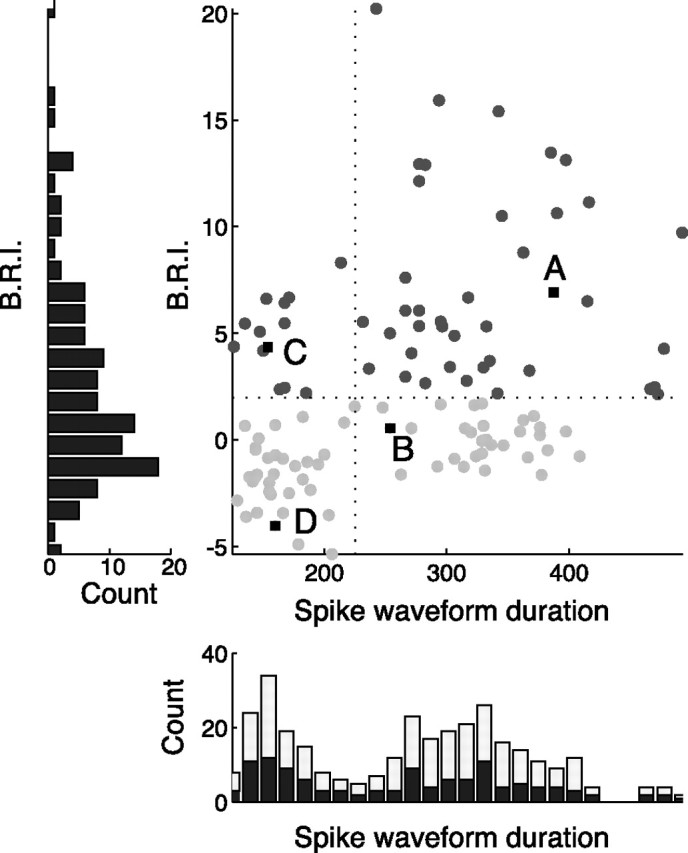
Figure 3.

Population scatter plot of spike waveform duration (microseconds) versus B.R.I. A–D indicate example units from Figure 2. Dark gray circles correspond to bursty neurons, defined as neurons whose burstiness exceeded 2 SDs of a rate-matched Poisson process (B.R.I. > 2). Light gray circles correspond to non-bursty cells. The left panel shows the distribution of the B.R.I. across the population, which was not significantly bimodal. The bottom panel shows the distribution of spike waveform durations, which is significantly bimodal both for visually driven cells (dark bars; Hartigan's dip test, p < 0.01) and the entire population (light bars indicate nonvisually driven neurons; Hartigan's dip test, p < 0.0001).
