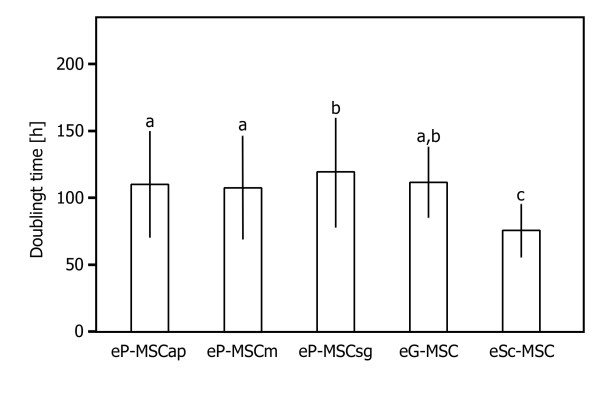
Figure 4.
Doubling time efficiency. Efficiency for self renewal assessed by calculations of population doubling times. Columns illustrate mean doubling time ± standard deviation. Three independent doubling time assays were performed for each cell populations. Statistical data analysis: multiple variance analysis with repeated measurements; Tukey post-hoc-test for multiple mean value comparisons. P values < 0.05 were considered statistically significant. Significant differences among cell sources were denoted by a, b and c (all p-values < 0.031).

