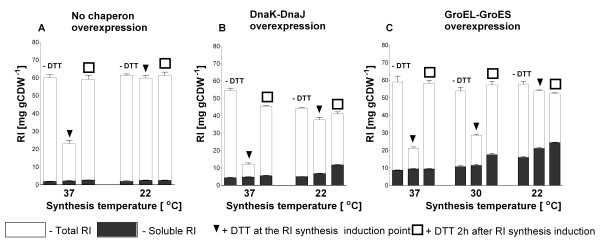
Figure 2.
Total (white bars) and soluble (black bars) RI amounts per cell unit [mg (g CDW)-1] after 4 hours of batch production in shake flask batch cultures of E. coli ER2566 pET21bRI (A) or with additional chaperone co-overexpression using the pKJE7 (DnaK/DnaJ/GrpE) (B) or pGro7 (GroELS) (C) vectors at 22, 30 or 37°C. Cultures were performed in glucose-MSM medium with addition of 12 mM DTT at the time of RI induction (squares), 2 hours after RI induction (triangles), or no addition of DTT (control). Induction of GroELS was performed with 0.4 g L-1 of arabinose 2 hours before RI induction (with 0.2 mM IPTG). All cultures were initially started at 37°C and shifted to the respective temperature at the time of RI induction. Standard deviations represent 3 assays.

