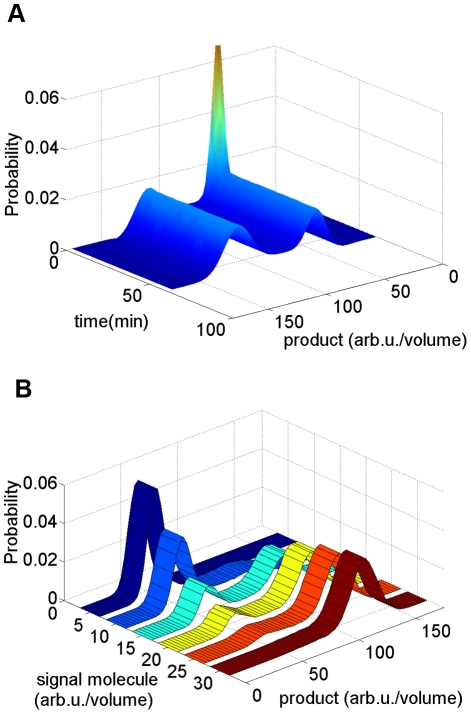
Figure 9. Bimodal distribution from no bistability.
Thirty five thousand cells are used for simulation. (A) Although there is no true steady state, the effect from the increment of  on standard deviation of the product protein distribution is small enough to consider the system as pseudo steady state. (B) The plot of product protein distribution with different add-in signal molecular precursor.

