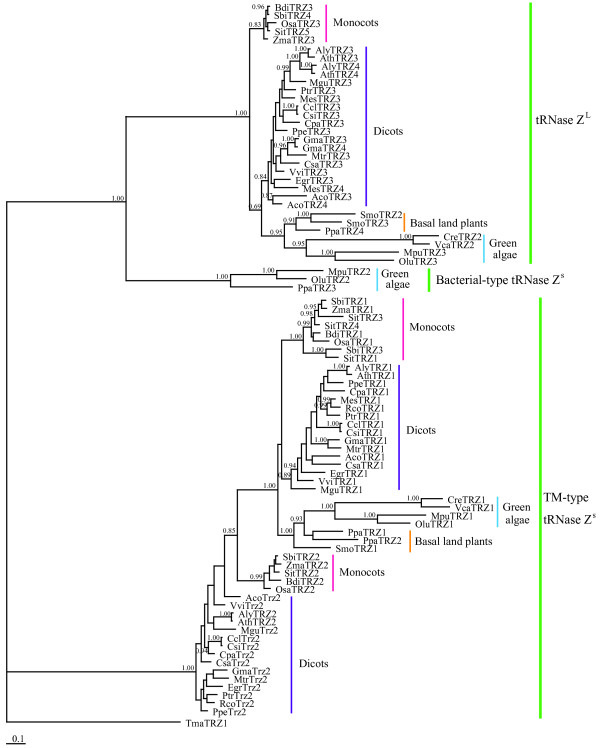
Figure 2.
Phylogram showing phylogenetic relationships among candidate green plant tRNase Zs. Posterior probabilities, which are indicated at the nodes, are generated by the Bayesian analysis. The scale bar indicates 0.1 nucleotide substitutions per site. For each protein, the species, the accession number and the database can be found in Additional file 1. Taxonomic designations are indicated on the right side of the tree.

