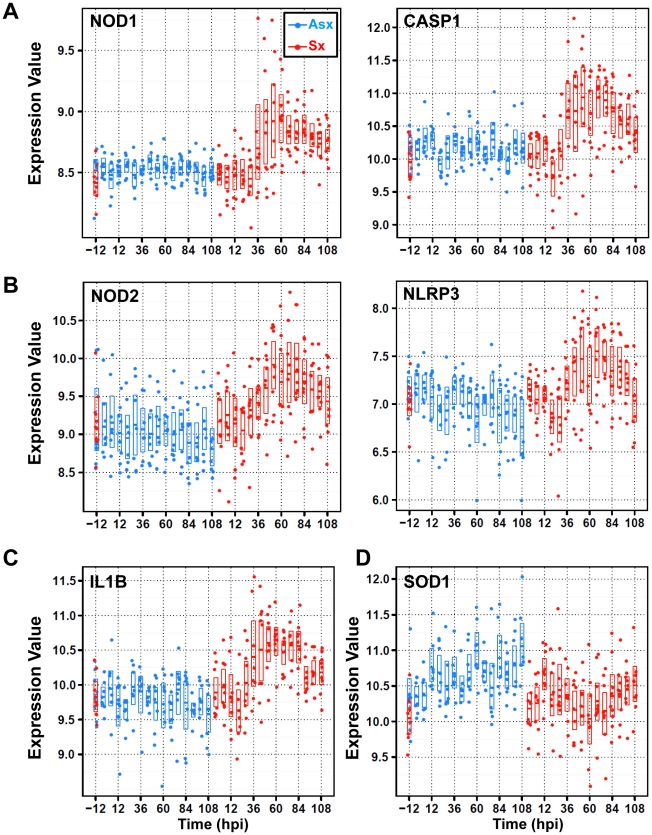
Figure 5. Divergent expression patterns of Nod/NACHT-LRR (NLRs) family of genes from cluster 2 and cluster 3 with contrasting expression of anti-oxidant/stress genes SOD1 and STK25 (or SOK1).
(A) SOM cluster 3 genes nucleotide-binding oligomerization domain containing 1 (NOD1) and caspase 1 (CASP1) display strong temporal upregulation in symptomatic subjects. (B) SOM cluster 2 genes NOD2 and NLRP3 exhibit downregulation in Asx hosts and upregulation in symptomatic subjects. (C) SOM cluster 2 gene interleukin 1 beta (IL1B) shows symptomatic-specific upregulation versus Asx-specific downregulation over time. (D) SOM cluster 6 genes superoxide dismutase (SOD1) shows upregulation versus downregulation in Asx and Sx hosts, respectively. The expression values are plotted on a log base 2 scale and all genes are significantly differentially expressed between Asx and Sx (q-value 0.0001; EDGE).

