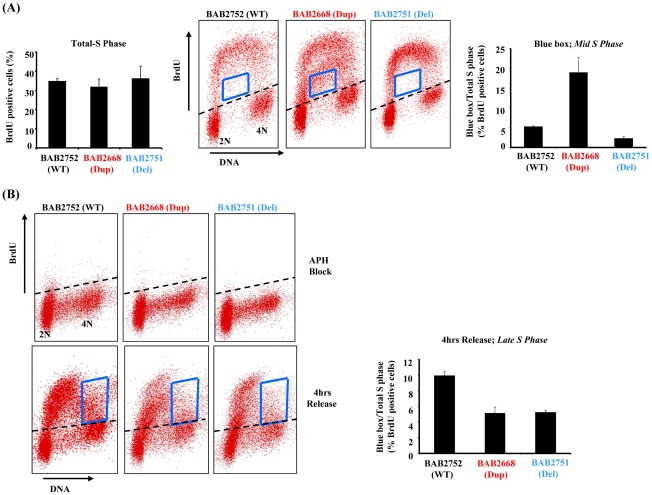
Figure 3. RPA1-duplication associated patient LBLs exhibit impaired DNA replication.
(A) Left hand graph; Quantification of two dimensional flow cytometry using BrdU pulse labelling (15 mins in 50 µM BrdU) followed by immunodetection shows that the level of BrdU incorporation is equivalent for all LBLs tested irrespective of their RPA1 copy number. Approximately 35–40% of cells from all lines incorporated BrdU following this pulse. Middle flow cytometry panels: The blue box indicates cells in mid-S phase (between 2N and 4N DNA content) that have inefficiently incorporated BrdU. Right hand graph: The relative amount of BrdU positive cells within the boxed area compared to total S phase (total BrdU positive cells). As a % of cells in S phase for each LBL following this pulse this amounts to approximately 5.7% for BAB2752 (WT), 18.7% for BAB2668 (RPA1 duplication) and 2.7% for BAB2751 (RPA1 haploinsufficient). Data represents the mean ± sd of three experiments. (B) Upper flow cytometry panels: Aphidicolin (APH; 10 µM 24 hrs) treatment dramatically inhibits BrdU incorporation equivalently in all LBLs as expected. Lower flow cytometry panels: 4 hrs after washing out of APH cells were pulse labelled with BrdU (15 mins 50 µM). The blue box indicates cells in late-S phase. Right hand graph: The relative amount of BrdU positive cells within the boxed area compared to total S phase (total BrdU positive cells). Both BAB2668 (RPA1 duplication) and BAB2751 (RPA1 haploinsufficient) LBLs show less incorporation of BrdU compared to BAB2752 (WT). Data represents the mean ± sd of three experiments.

