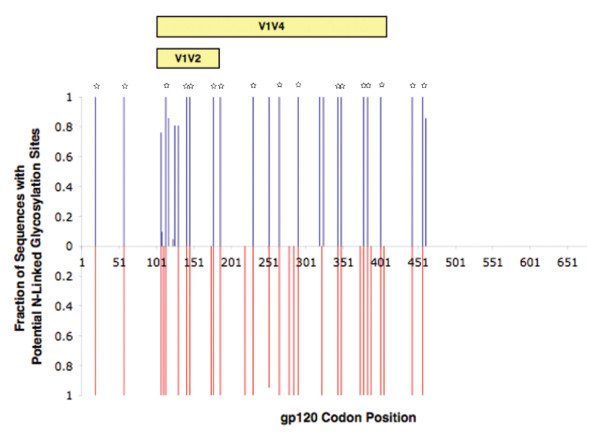
Figure 5.
Comparison of PNLGSs in inferred env gp120 amino acid sequences. Full-length gp120 amino acid sequences, inferred from day 63 SGA nucleotide sequences, are shown. The proportion of P1 sequences with PNLGS at a particular position are shown as a 'positive' blue bar and the proportion of P2 sequences with a PNLGS is shown as a 'negative' red bar. Positions where 100% of sequences have and PNLGS in both P1 and P2 are indicated by small stars.

