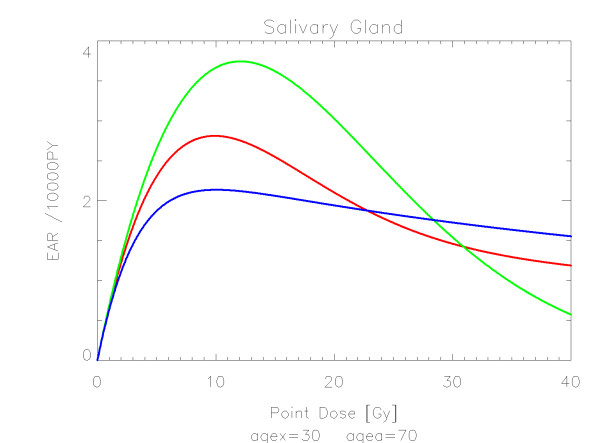
Figure 13.
Plot of excess absolute carcinoma risk for cancer of the salivary glands per 10,000 persons per year as a function of point dose in the organ. The bell-shaped, plateau and full dose-response relationships are depicted by the green, blue and red line, respectively. The fits are presented for age at exposure of 30 years and attained age of 70 years.

