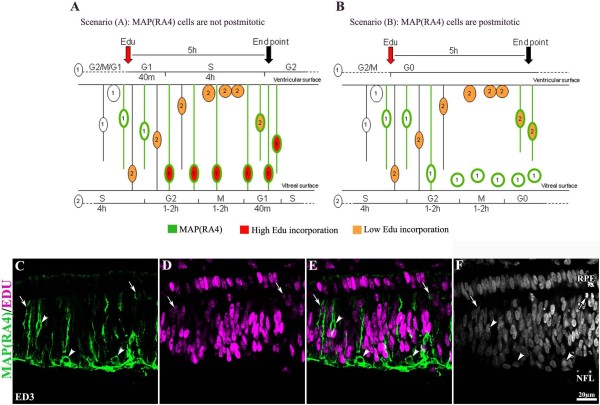
Figure 3.
MAP(RA4) is expressed in postmitotic retinal cells. (A-B) Schematic representation of two possible scenarios: (A) MAP(RA4) is expressed by non-postmitotic cells; and (B) MAP(RA4) is expressed only by postmitotic cells. Cells numbered with (1) represent the cell population that was at either G2, M or G1, but not S, at the time of EdU delivery (red arrow), while cells numbered with (2) represent cells that were at the last phase of S at the time of EdU delivery. The numbers below S, G2, M and G1 indicate the average length of the corresponding cell cycle steps. The black arrow indicates the time of embryo harvesting and analysis. (C-F) Transverse section of an ED3 retina processed for immunolabeling of MAP(RA4) (green) and EdU incorporation (magenta). MAP(RA4) positive cells can be seen spanning the retina from the ventricular to the vitreal surface (A). Only MAP(RA4) positive cells that are closest to the ventricular surface are EdU positive (C-E; arrows). Arrowheads indicate MAP(RA4) positive/EdU negative cells. NFL: nerve fiber layer; RPE: retina pigmented epithelium.

