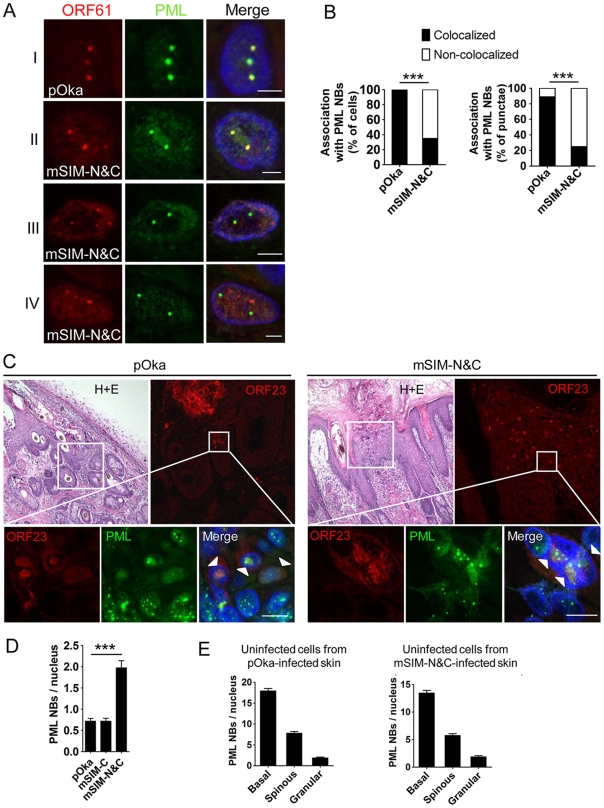
Figure 7. ORF61 SIMs are required for ORF61 association with and dispersal of PML NBs in skin cells in vivo.
(A) Confocal microscopy of pOka- or pOka-mSIM-N&C-infected skin cells that were stained for ORF61 (red), PML (green), and nuclei (blue). The images show association of ORF61-positive puncta with PML NBs in newly infected cells. Scale bars: 2.5 µm. (B) Quantitation of ORF61/PML NB association in pOka- or pOka-mSIM-N&C-infected cells that had ORF61-positive puncta. The left panel shows percentage of cells that show/did not show ORF61 colocalization with PML NBs (pOka, N = 47; mSIM-N&C, N = 46; ***, p<0.0001 by Chi-square). The right panel shows percentage of ORF61-positive puncta colocalized/not colocalized with PML NBs (pOka, N = 167; mSIM-N&C, N = 202; ***, p<0.0001 by Chi-square). (C) Confocal microscopy of pOka- or pOka-mSIM-N&C-infected skin cells that were stained for ORF23 (red), PML (green), and nuclei (blue). For each panel (left and right), the upper left image shows skin structures of a parallel section by hematoxylin and eosin (H+E) staining; the upper right image shows epidermal cells from the white square area on the upper left image (the infected cells were identified by ORF23 expression); the lower images show PML NBs in ORF23-positive cells and neighboring uninfected cells from the white square area on the upper right image. White arrows indicate cells with abundant nuclear ORF23 protein. Scale bars: 10 µm. (D) PML NB frequencies (mean±SEM) in pOka- or ORF61 SIM mutants-infected skin cells (pOka, N = 153; mSIM-C, N = 143; mSIM-N&C, N = 108; ***, p<0.0001 by t-test). (E) PML NB frequencies (mean±SEM) in uninfected skin cells from pOka- or pOka-mSIM-N&C-infected skin xenografts. Cells from the three major epidermal layers were grouped. Uninfected cells from pOka-infected skin: basal layer cells (N = 99), spinous layer cells (N = 79), granular layer cells (N = 45). Uninfected cells from pOka-mSIM-N&C-infected skin: basal layer cells (N = 109), spinous layer cells (N = 124), granular layer cells (N = 39).

