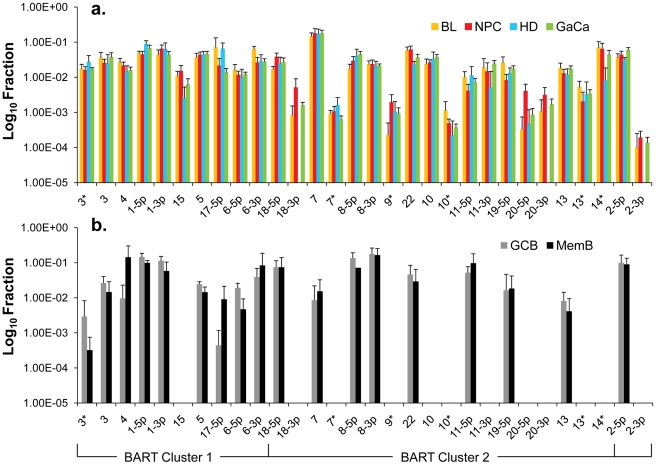
Figure 3. Profile of EBV BART miRNAs in normal and neoplastic tissue.
The data is expressed as average and standard deviation of the fraction that each miRNA constitutes of the total of all EBV miRNAs. A. The four tumor types tested. Blue – Hodgkin's disease (n = 3): yellow – Burkitt's lymphoma (n = 6): green - gastric carcinoma (n = 6): red - nasopharyngeal carcinoma (n = 6). B. Normal infected tissue. Grey – GCB (n = 5), black – MemB (n = 4). The y intercept is a conservative approximation to the sensitivity of the assay (this will vary according to the input number of infected cells). It represents the fraction for a miRNA present at 10 copies, the lower limit of sensitivity for detection of all the miRNAs [16]. N.B. The miRNAs are presented on the x-axis from left to right in the order that they appear in the viral genome (see Figure 1).

