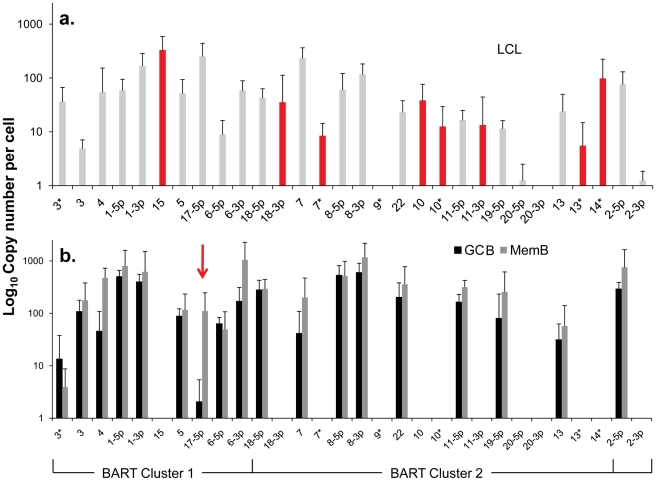
Figure 4. Profile of EBV BART miRNAs in vivo and in spontaneous lymphoblastoid cell lines (LCL) expressing latency III.
The data is expressed as copy number of each miRNA per infected cell. A. Spontaneous lymphoblastoid cell lines LCL (n = 6). miRNAs that are significantly expressed in LCL but not GCB and MemB are highlighted in red. B. Normal infected tissue. Grey – GCB (n = 5), black – MemB (n = 4). This is the same data set as Figure 3A except now expressed as copy number /cell instead of fraction. The y intercept is an approximation to the sensitivity of detection based on the following. The maximum number of infected cells tested for GCB and MemB was 4–6×10³ (Table 1). Approximately 0.1% of the RNA from these samples was used for each PCR reaction i.e. equivalent to ∼5 infected cells. Since we can detect as few as 10 copies of each miRNA [16], we conclude that failure to detect a miRNA in any sample indicates it is present at a copy number ≤1/cell. The red arrow indicates miRNA 17-5p which was the only miRNA to show a striking differential expression between GCB and MemB cells. N.B. The miRNAs are presented on the x-axis from left to right in the order that they appear in the viral genome (see Figure 1).

