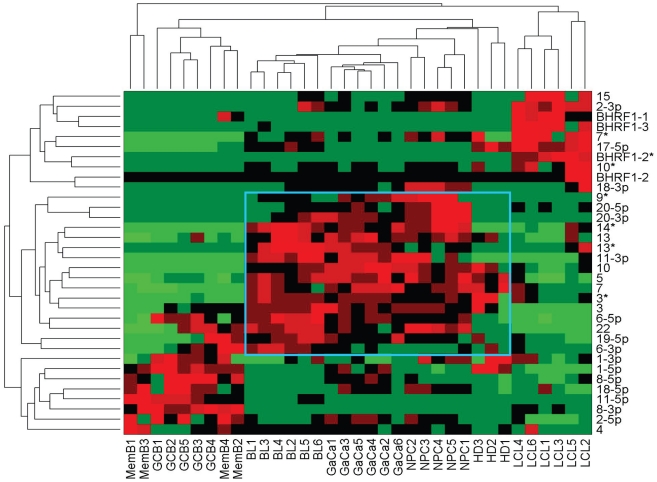
Figure 7. Heat map of miRNA expression in all tissues tested.
The data sets used in Figure 3 and 4 were normalized based on the fraction that each miRNA comprised of the total EBV miRNA measured in each sample. A complete description is given in materials and methods. The relative up and down regulation of miRNAs is indicated by red and green respectively. Dendrograms of clustering analysis for samples and miRNAs are displayed on the top and left respectively. Tumors, forming a distinct branch on both the sample and miRNA dendrograms, are boxed in blue.

