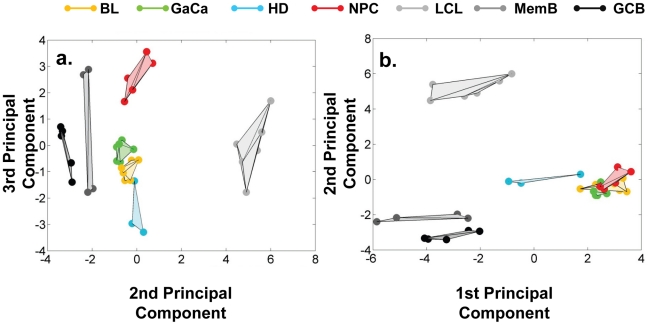
Figure 8. Principal component analysis (PCA) of miRNA expression in all tissues tested.
PCA was performed on the same data set as shown in Figure 7. A. Second and third principal components B. First and second principal components. For a demonstration of all three components simultaneously see Video S1.

