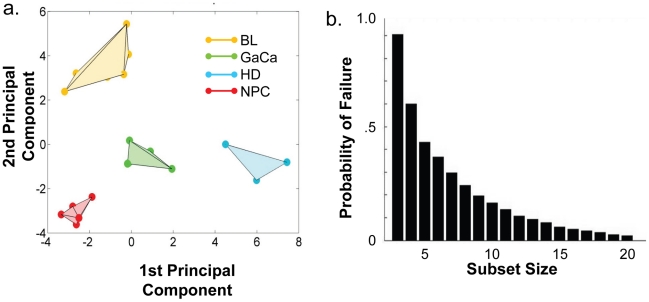
Figure 9. Principal component analysis of miRNA expression in all tumors tested.
PCA was performed on the same data set used in Figure 3A. A. The first two principal components resolve the four tumor types. For a movie demonstrating the first three principal components see Video S2. B. Subsets containing as few as 3 miRNAs resolve the tumor types. This figure plots the failure rate of different sized sets of miRNAs. For each set size, 10,000 randomly chosen subsets were tested. N.B. this represents over sampling for the subset n = 3

