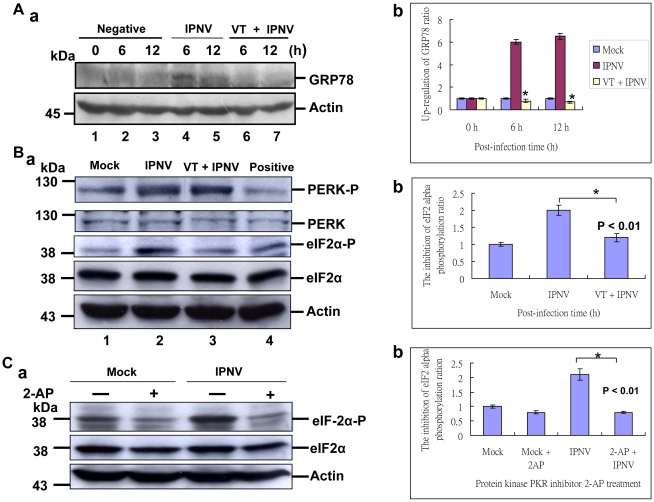
Figure 4. Identification of PKR/PERK two signal pathways on eIF2 phosphorylation in CHSE-214 cells with IPNV infection.
Pretreatment chaperone GRP78 inhibitor VT (1 µg/mL) with CHSE-214cells for two hours, then infection of IPNV in CHSE-214 cells following incubation for 0 h, 6 h and 12 h p.i. (A:a) western blot analysis of GRP78 protein expression in IPNV-infected CHSE-214 cells. IPNV-infected CHSE-214 cells at 6 h p.i. (lane 4) and at 12 h p.i. (lane 5); with VT (1 µg/mL) treatment at 6 h p.i. (lane 6), and at 12 h p.i. (lane 7); uninfected cells at 0 h p.i. (lane 1), 6 h (lane 2) and 12 h (lane 3). Actin was used as an internal control in lanes 1–7. Quantification of GRP78 expression levels in IPNV-infected cells at early and middle replication stages. (A:b) Protein expression level was quantified by Personal Densitometer (Molecular Dynamic). Data (three times independent experiments) was analyzed using either or unpaired Student t-tests as appropriate at 0, 6 and 12 h pi. A value of p<0.05 was taken to represent a statistically significant difference between mean values of groups. (B:a) western blot analysis of PERK and eIF2α protein phosphorylation level in IPNV-infected CHSE-214 cells at 12 h p.i.; lane 1 without IPNV-infected cells; lane 2, IPNV-infected CHSE-214 cells; lane 3, with VT (1 µg/mL) treatment and IPNV-infected CHSE-214 cells; lane 4, with ER stress drug A23187 treatment for 2 hours. Actin was used as an internal control in lanes 1–4. (B:b) Quantification of eIF2α protein phosphorylation level in IPNV-infected cells at middle replication stage. Protein expression level was quantified by Personal Densitometer (Molecular Dynamic). (C:a) western blot analysis of eIF2α protein phosphorylation level in IPNV-infected CHSE-214 cells at 12 h pi. IPNV-without infected cells (lane 1); with protein kinase inhibitor 2-aminopurine (2-AP; 20 mM) pretreatment two hours CHSE-214 cells; with IPNV-infected CHSE-214 cells (lane 3); with 2-AP treatment plus IPNV-infected CHSE-214 cells (lane 4). Actin was used as an internal control in lanes 1–4. (C:b) Quantification of eIF2α protein phosphorylation level in IPNV-infected cells at middle replication stage. Protein expression level was quantified by Personal Densitometer (Molecular Dynamic).

