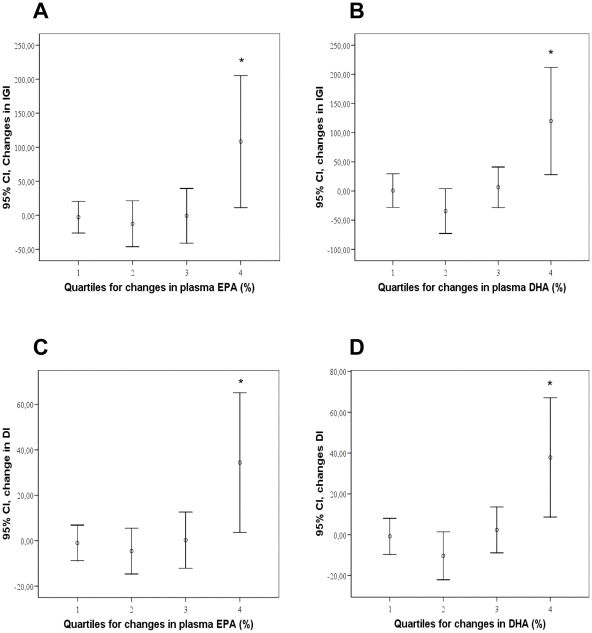
Figure 4. Associations between glucose metabolism and plasma EPA and DHA content.
Changes in insulinogenic index (IGI) (A and B) and disposition index (DI) (C and D) during the intervention period (95% Confidence interval) according to quartiles of changes in plasma EPA (A and C) and DHA (B and D) content (%). * p<0.01 in Kruskal-Wallis test. All groups combined, n = 99. Ranges of changes in EPA quartiles: 1 = −2.3–0.4% units; 2 = −0.3−0.1% units; 3 = 0.1−0.6% units; 4 = 0.6−4.2% units, and in DHA quartiles: 1 = −2.4–0.6% units; 2 = −0.6–0.1% units; 3 = −0.04−0.7% units; 4 = 0.7−3.0% units.

