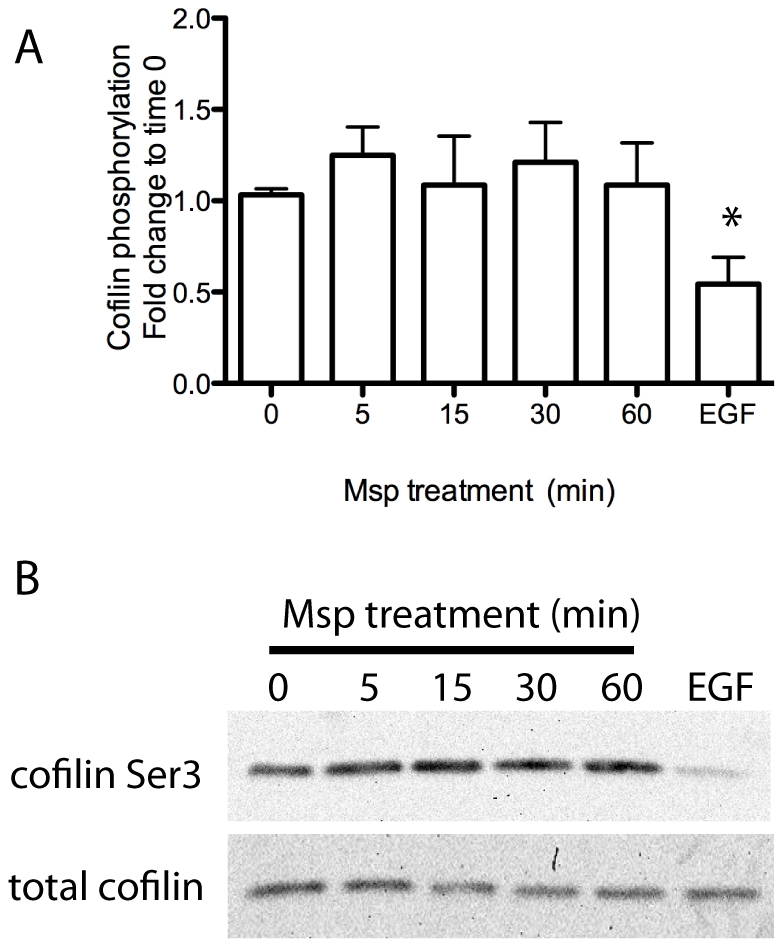
Figure 8. Msp increases cofilin phosphorylation.

Cofilin activity as measured by phosphorylation at serine 3 in Msp-treated cell lysates was analyzed by immunoblotting. Densitometry analysis is shown in panel A. Graph represents mean ± SEM of 3 experiments. (*P<0.05). A representative immunoblot is shown in panel B. EGF treated cell lysates serves as a positive control for cofilin dephosphorylation.
